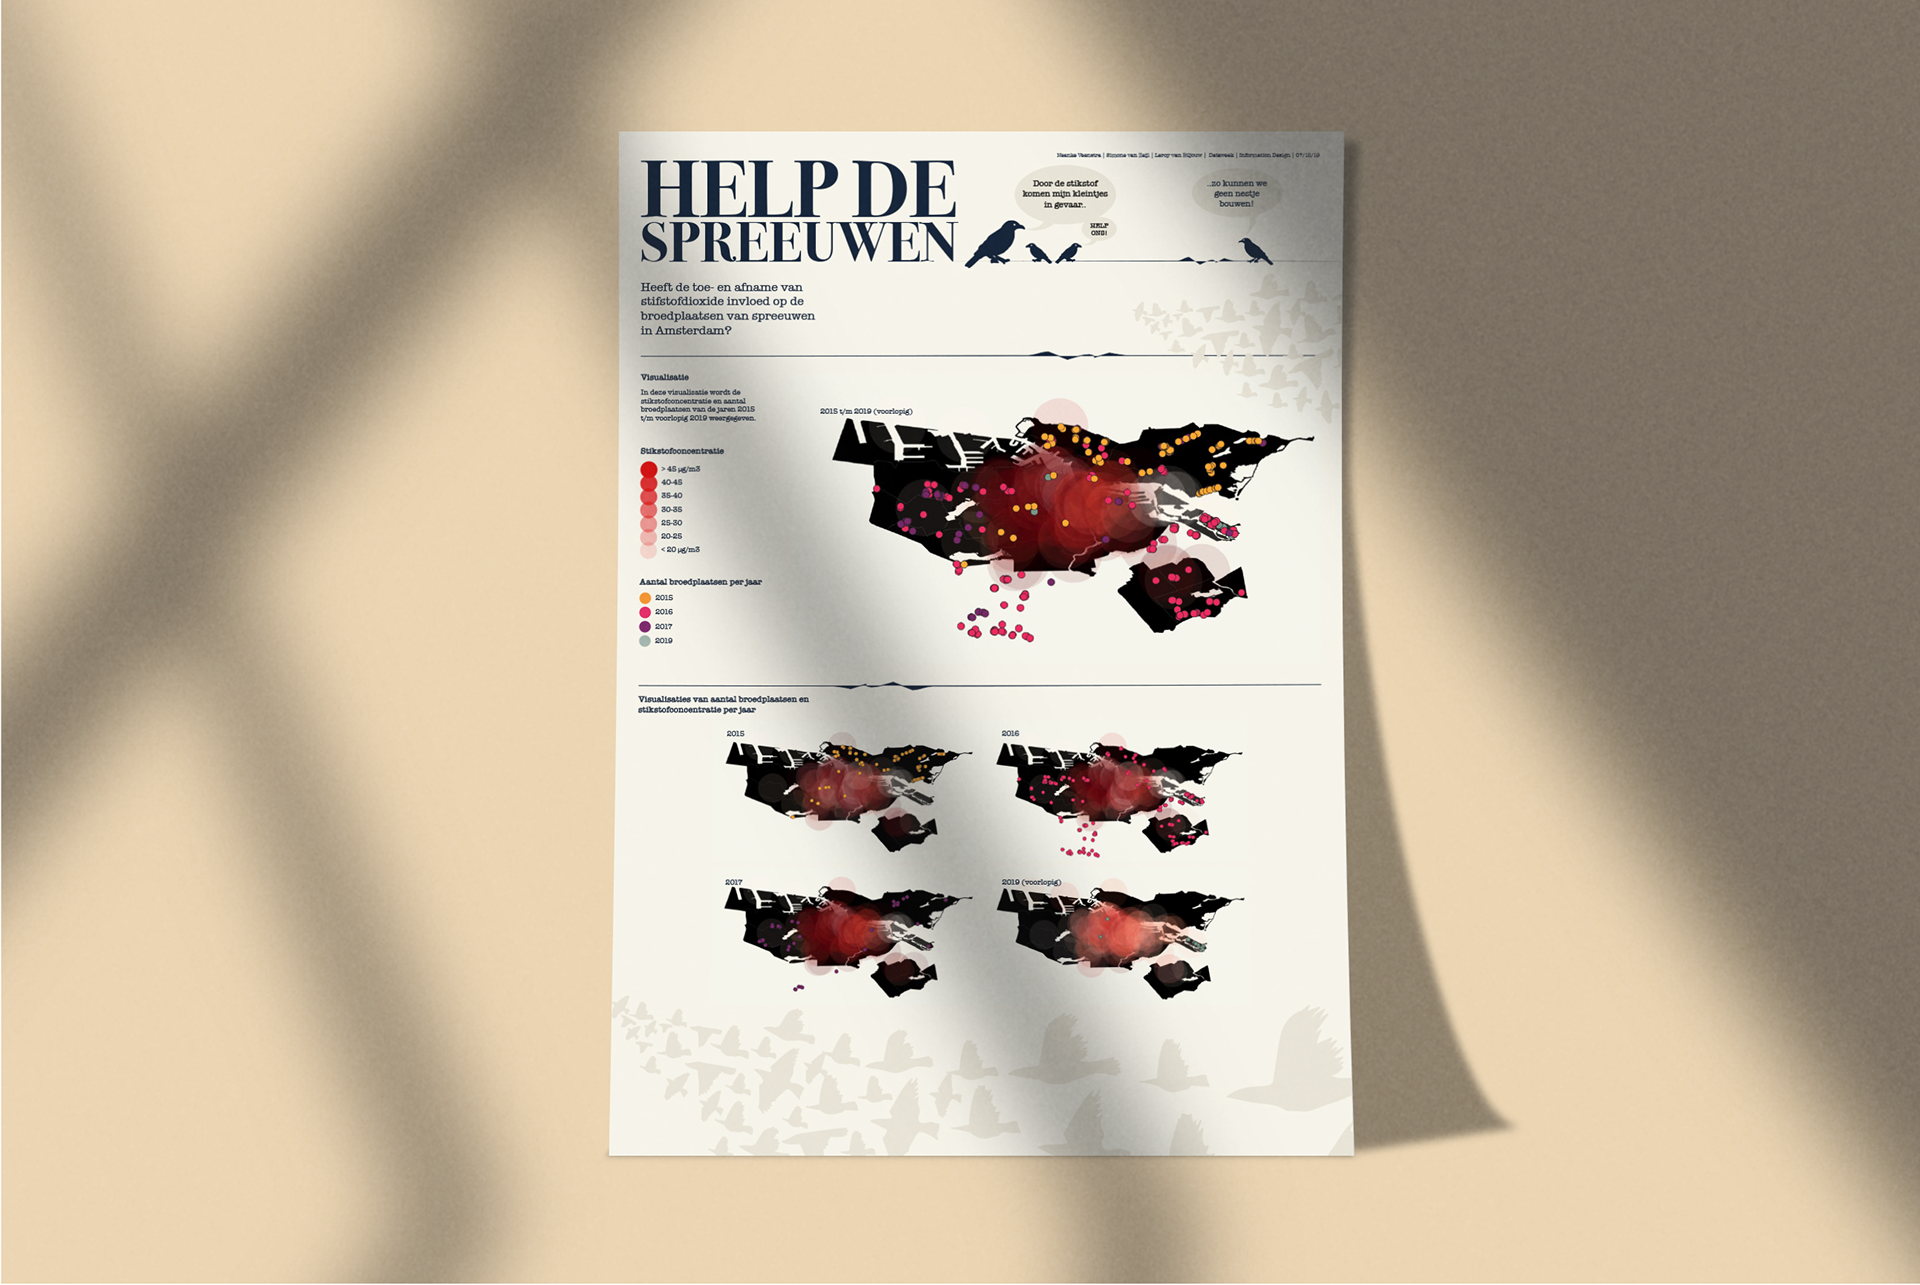
Help de spreeuwen
During the Dataweek from the HvA I was commissioned to design a data visualization based on two datasets provided by the municipality of Amsterdam. ‘Help de spreeuwen!’ or ‘Help the starlings!’ visualizes the effects of the increase and reduction of nitrogen dioxide on the nesting sites of starlings in Amsterdam. Are you interested if it affects the nesting behaviour of starlings? Take a look at the poster!
Date: November, 2019
Date: November, 2019
Software: Adobe Illustrator, Adobe Indesign
Commissioned for: Communcation and Multimedia Design (HvA - Amsterdam University of Applied Sciences)